LA-City-Webtraffic-Forecasting
This project aims to give a detailed step-by-step analysis of the time series data, collected from the lacity.org website in an attempt to analyze its web traffic pattern. You can find the project here.
Analysis
Here, we have come up with a descriptive analysis and a predictive model. Through the report we have addressed to the weekly cycle pattern and outliers observed in the data.
We have decomposed the data and applied data smoothing technique to make the data more stable and predictable. We also tested to find that the data is non-stationary and therefore fitted a non-stationary model.
Forecasting
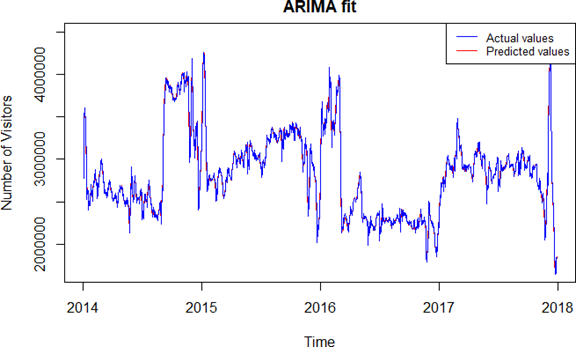
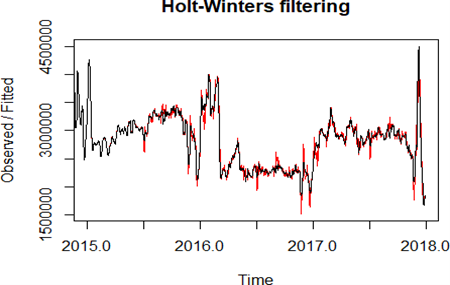
Forecasting daily number of visitors from a dataset can be tricky as it contains multiple seasonal cycles, despite the smoothening. It should also be noted that the extrapolated forecasts are based entirely on the trends in the period during which the model was fitted and would be a sensible prediction assuming these trends continue. So we choose to use Holt-Winters model with alpha=1 and gamma=1 for forecasting long term predictions and ARIMA(5,1,3) could be used for short term forecasts.
Conclusion
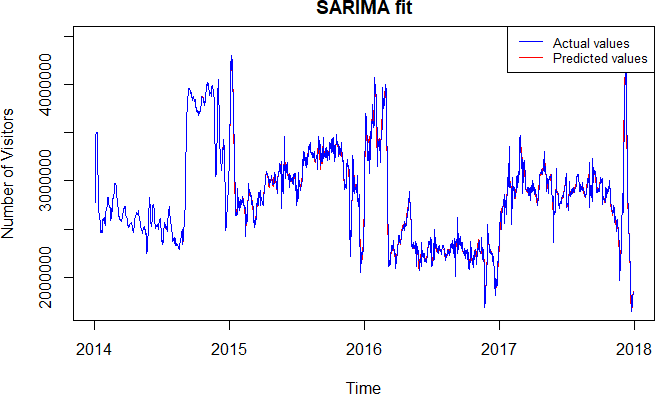
Our models only allow for regular seasonality, despite the fact that we have smoothened the data. Capturing seasonality associated with moving events such as Easter, Christmas, or the New Year is more difficult. If our time-series were relatively short which captured a single seasonality our fitted models would have worked better, as it could be seen from the forecasts of SARIMA model.